Technical Analysis of Stocks – Basics
FUNDAMENTALS OF TECHNICAL ANALYSIS
INTRODUCTION
The methods used to analyze securities and make investment decisions fall into two very broad categories: Fundamental Analysis and Technical Analysis. Fundamental analysis involves analyzing the characteristics of a company in order to estimate its value. Technical analysis takes a completely different approach; it doesn't care one bit about the "value" of a company or a commodity. Simply we can say that, Fundamental analysis means ‘what to buy/sell’ and Technical analysis means ‘when to buy/sell. Despite all the fancy and exotic tools it employs, technical analysis really just studies supply and demand in a market in an attempt to determine what direction, or trend, will continue in the future. In other words, technical analysis attempts to understand the emotions in the market by studying the market itself, as opposed to its components. If you understand the benefits and limitations of technical analysis, it can give you a new set of tools or skills that will enable you to be a better trader or investor. Technicians (sometimes called chartists) are only interested in the price movements in the market.
What is Technical Analysis?
Technical analysis is a method of evaluating securities by analyzing the statistics generated by market activity, such as past prices and volumes. The field of technical analysis is based on three assumptions:
- The Market Discounts Everything: A major criticism of technical analysis is that it only considers price movement, ignoring the fundamental actors of the company. However, technical analysis assumes that, at any given time, a stock's price reflects everything that has or could affect the company - including fundamental factors. Technical analysts believe that the company's fundamentals, along with broader economic factors and market psychology, are all priced into the stock, removing the need to actually consider these factors separately. This only leaves the analysis of price movement, which technical theory views as a product of the supply and demand for a particular stock in the market.
- Price moves in Trends: In technical analysis, price movements are believed to follow trends. This means that after a trend has been established, the future price movement is more likely to be in the same direction as the trend than to be against it. Most technical trading strategies are based on this assumption.
- History Tends To Repeat Itself: Another important idea in technical analysis is that history tends to repeat itself, mainly in terms of price movement. The repetitive nature of price movements is attributed to market psychology; in other words, market participants tend to provide a consistent reaction to similar market stimuli over time. Technical analysis uses chart patterns to analyze market movements and understand trends.
HISTORY OF TECHNICAL ANLAYSIS
The principles of technical analysis are derived from hundreds of years of financial data. Some aspects of technical analysis began to appear in Joseph de la Vega's accounts of the Dutch markets in the 17th century. In Asia, technical analysis is said to be a method developed by Homma Munehisa during early 18th century which evolved into the use of candlestick techniques, and is today a technical analysis charting tool. Technical Analysis as a tool of investment for the average investor thrived in the late nineteenth century when Charles Dow, then editor of the Wall Street Journal, proposed the Dow Theory.
He recognized that the movement is caused by the action/reaction of the people dealing in stocks rather than the news in itself. As is obvious, early technical analysis was almost exclusively the analysis of charts, because the processing power of computers was not available for statistical analysis. Charles Dow reportedly originated a form of —point and figure chart analysis.
Dow Theory is based on the collected writings of Dow Jones co-founder and Editor Charles Dow, and inspired the use and development of modern technical analysis at the end of the 19th century. Other pioneers of analysis techniques include Ralph Nelson Elliott, William Delber Gann and Richard Wyckoff who developed their respective techniques in the early 20th century. More technical tools and theories have been developed and enhanced in recent decades, with an increasing emphasis on computer-assisted techniques using specially designed computer software.
HOW IS TECHNICAL ANALYSIS DONE?
Technical Analysis is done by identifying the trend from past movements and then using it as a tool to predict future price movements of the stock. It can be done by using any of following methods:
- Charts & Patterns.
- Trends & Channels Identification
- Indicators & Overlays
- Market Analysis with the help of Dow Theory, Elliot wave theory, Gann’s theory & Fibonacci trading, etc.
Generally, Technical analysis and fundamental analysis are the two main schools of thought in the financial markets. As we've mentioned, technical analysis looks at the price movement of a security and uses this data to predict its future price movements. Fundamental analysis, on the other hand, looks at economic factors, known as fundamentals. Not only is technical analysis more short term in nature than fundamental analysis, but the goals of a purchase (or sale) of a stock are usually different for each approach. In general, technical analysis is used for a trade, whereas fundamental analysis is used to make an investment. Investors buy assets they believe can increase in value, while traders buy assets they believe they can sell to somebody else at a greater price. The line between a trade and an investment can be blurry, but it does characterize a difference between the two schools.
NIFTY PRICE VOLUME ANALYSIS CHART
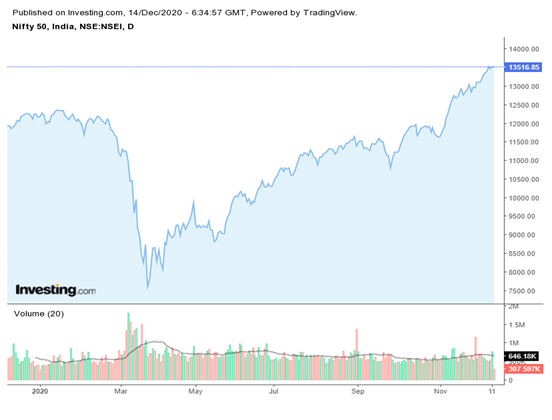
Image Source: www.investing.com
Role of Volume:
Volume is an important aspect of technical analysis because it is used to confirm trends and chart patterns. Any price movement up or down with relatively high volume is seen as a stronger, more relevant move than a similar move with weak volume. Therefore, if you are looking at a large price movement, you should also examine the volume to see whether it tells the same story. Say, for example, that a stock jumps 5% in one trading day after being in a long downtrend. Is this a sign of a trend reversal? This is where volume helps traders. If volume is high during the day relative to the average daily volume, it is a sign that the reversal is probably for real. On the other hand, if the volume is below average, there may not be enough conviction to support a true trend reversal. Volume should move with the trend. If prices are moving in an upward trend, volume should increase (and vice versa). If the previous relationship between volume and price movements starts to deteriorate, it is usually a sign of weakness in the trend. For example, if the stock is in an uptrend but the up trading days are marked with lower volume, it is a sign that the trend is starting to lose its legs and may soon end. The other use of volume is to confirm chart patterns. Patterns such as head and shoulders, triangles, flags and other price patterns can be confirmed with volume. Basically, if the volume is not there to confirm the pivotal moments of a chart pattern, the quality of the signal formed by the pattern is weakened.
PROS AND CONS OF TECHNICAL ANALYSIS
Technical analysis has been a part of financial practice for many decades. It is a method of predicting price movements and future market trends by using charts. It is Necessary for you to know the pros and cons of technical analysis so that you can trade with complete ease. So, let’s find out some of the merits of technical analysis.
- Technical analysis only focuses on charts and tools and takes no account of feelings or any other less precise factors.
- Technical analysis allows to the traders to make short term trades.
- One of the great advantages of technical analysis is that it can assist you in the basics of stock trading. It will also help you to decide how and when to enter the market, how many lots to trade at any one time, how much money to risk on each trade, etc.
- Technical indicators can sometimes point to the end of a trend before it shows up in the market. This will help you hold on to your profit and minimize your losses.
- Let’s check out the demerits of technical analysis:
- It can be dangerous to depend totally on the assumption that today's prices predict future prices. They often do, but not necessarily.
- Relying on charts completely will not help you to pick up the signals about the changing of a trend until the change has actually taken place. This means you could miss up to one-third of the fluctuations in stock trading.
- Technical analysis is very attractive because it is based on math and statistics, thus giving the illusion of accuracy and predictability.
CHARTING TERMS & INDICATORS
TYPES OF CHARTS
CONCEPTS
OVERLAYS
INDICATORS